Notes to self, 2025
2025-12-02 - ubuntu / gnome config / issues / 2025
I had flushed my desktop and was ready to start fresh. Still using Ubuntu for now. It does take a few hacks and tricks to get my system right.
Disable and purge snap
For one, I'm removing snap. The Ubuntu Snap takeover has cost me so many man hours. As mentioned in the linked post, removing it and going with the Linux Mint packages was a great decision. Not once have I regretted not having Snap installed. The post was already future-proof with the availability of Thunderbird in the preferences file. Enabled now:
# Don't use Linux Mint for other packages.
Package: *
Pin: origin "/^(packages.linuxmint.com)/"
Pin-Priority: -1

# Never install snap.
Package: snapd
Pin-Priority: -1

# Pinning does not need to go above 1000 because we do not need to
# downgrade. Ubuntu does not ship with a chromium package.
Package: chromium
Pin: origin "/^(packages.linuxmint.com)/"
Pin-Priority: 600

# Firefox depends on ubuntu-system-adjustments, but you can install
# https://github.com/wdoekes/nosnap-deb/releases/download/v0.1/nosnap_0.1_all.deb
# as replacement.
Package: firefox firefox-locale-*
Pin: origin "/^(packages.linuxmint.com)/"
Pin-Priority: 1000

# Since Ubuntu/Noble we've lost Thunderbird to snap as well.
Package: thunderbird thunderbird-locale-*
Pin: origin "/^(packages.linuxmint.com)/"
Pin-Priority: 1000
GNOME tweaks
Enabling seconds in the top clock and configuring the compose key was already documented in the welcome GNOME shell post:
$ gsettings set org.gnome.desktop.interface clock-show-seconds true
$ gsettings set org.gnome.desktop.input-sources xkb-options "['compose:ralt']"
(Also the visual bell, but more on that below.)
I had previously worked with custom extensions for three side-by-side windows. But that broke at some point, and I didn't miss it enough to fix it. So that will have to wait.
GNOME super+left/right extra popup
In Ubuntu/Noble a funky plugin feature was introduced that forces you to choose a second window after moving a window to the left or right using Super+Left/Right. This is terribly unergonomic. Disable that:
$ gsettings set org.gnome.shell.extensions.tiling-assistant enable-tiling-popup false
Or, maybe as effective, disable the entire plugin:
$ gnome-extensions list --enabled | grep tiling
tiling-assistant@ubuntu.com

$ gnome-extensions disable tiling-assistant@ubuntu.com
OpenVPN with openvpn-u2f-ask-password
Setting up the openvpn-u2f-ask-password.service to work exactly as I wanted with openvpn running as root, is slightly more complicated than I'd like, but I knew that and copied the settings from the previous install.
gpg-agent precedence
Enabling the gpg-agent was also a bit more complicated. Apart from adding enable-ssh-support to ~/.gnupg/gpg-agent.conf and configuring ~/.gnupg/sshcontrol I also had to replace ~/.config/environment.d/gpg-agent.conf:
GPG_AGENT_INFO=/run/user/1000/gnupg/S.gpg-agent:0:1
SSH_AUTH_SOCK=/run/user/1000/gnupg/S.gpg-agent.ssh
And above all, disable not one but two ssh-agent alternatives. The GNOME one:
$ (cat /etc/xdg/autostart/gnome-keyring-ssh.desktop; echo Hidden=true) \
    >~/.config/autostart/gnome-keyring-ssh.desktop
And the CLI one using ~/.config/systemd/user/ssh-agent.service.d/override.conf:
[Unit]
ConditionPathExists=!/home/walter/.gnupg/sshcontrol
Visual bell causing darkness bug
Lastly, there is the matter of the visual bell bug that causes windows or parts of the screen to go dark when bells are fired during a locked screen.
If you're using:
$ gsettings set org.gnome.desktop.wm.preferences audible-bell false
$ gsettings set org.gnome.desktop.wm.preferences visual-bell true
$ gsettings set org.gnome.desktop.wm.preferences visual-bell-type frame-flash
A visual bell during a lock screen will then cause the window to go dark, as documented in gnome terminal lp#2064716, gnome-shell lp#2113786 and libmutter commit 906920c.
Setting the visual bell to fullscreen-flash
instead of frame-flash makes it noticeably less bad. But
it's still a shame that this bug has persisted for so long.
2025-09-30 - proxmox vm / no arp replies / mellanox nic
Recently, when upgrading a Proxmox host from 7.2 to 8.4, we ran into a strange issue. The hypervisor host had network connectivity, but the VM guests did not. The upgrade was continued to Proxmox 9.0, but that did not fix the problem.
The host was fine. We could ssh in, ping the gateway, do updates, whatever — but the guests had trouble communicating. In particular: the guests appeared unable to find the gateway at layer 2.
This upgrade process happened on a test system that might not have been the cleanest of systems. So the culprit could be anywhere, and after several hours of poking around I was ready to throw the proverbial towel in the ring. To make matters worse, I wasn't involved with this system and was unaware of which changes had been made. For all I knew, things had been changed on the peer side as well.
Missing ARP replies
What do I mean by “unable to find the gateway”?
When a machine wants to send a packet to another machine over Ethernet, it first needs the MAC (hardware) address of the layer 2 (L2, Ethernet) peer. For communication outside its own network, it needs the address of the gateway.
Usually these MAC addresses are learnt automatically, but sometimes an explicit query has to be made. In this case the virtual machine (VM) broadcasts an ARP who-has request on the network: “Who has 10.20.30.32?” The gateway (at 10.20.30.32) should respond with an ARP is-at reply, providing its MAC.
Here's what tcpdump showed on the host:
# tcpdump -enni enmlx0 vlan and arp

11:54:40.417131 bc:24:11:xx:xx:xx > ff:ff:ff:ff:ff:ff,
  ethertype 802.1Q (0x8100), length 46: vlan 66, p 0, ethertype ARP (0x0806),
  Request who-has 10.20.30.32 tell 10.20.30.33, length 28
You see the who-has from 10.20.30.33 asking for the physical address of 10.20.30.32. This kept repeating. No other traffic could be seen for VLAN 66. And because no is-at reply was in sight, the VM obviously had trouble communicating: no L3 traffic is possible without L2.
The VM sat in bridge vmbr66, and the host that did have connectivity was communicating on bridge vmbr55:
# brctl show

bridge name  bridge id           STP enabled  interfaces
vmbr55       8000.248a07xxxxxx   no           enmlx0.55
vmbr66       8000.248a07xxxxxx   no           enmlx0.66
                                              tap140i0
# ip -br a

lo               UNKNOWN        127.0.0.1/8 ::1/128
enmlx0           UP             fe80::268a:7ff:xxxx:xxxx/64
enmlx0.55@enmlx0 UP
vmbr55           UP             192.168.2.3/31 fe80::268a:7ff:xxxx:xxxx/64
enmlx0.66@enmlx0 UP
vmbr66           UP             fe80::268a:7ff:xxxx:xxxx/64
tap140i0         UNKNOWN
On the directly connected Cumulus L3 switch, we could sniff the traffic as well:
# tcpdump -enni swp56s1 vlan and arp

11:54:40.417428 bc:24:11:xx:xx:xx > ff:ff:ff:ff:ff:ff,
  ethertype 802.1Q (0x8100), length 60: vlan 66, p 2, ethertype ARP,
  Request who-has 10.20.30.32 tell 10.20.30.33, length 42

11:54:40.417479 d8:c4:97:xx:xx:xx > bc:24:11:xx:xx:xx,
  ethertype 802.1Q (0x8100), length 46: vlan 66, p 0, ethertype ARP,
  Reply 10.20.30.32 is-at d8:c4:97:xx:xx:xx, length 28
It's really nice that we can do traffic sniffing on these switches. But you have to keep several things in mind: (1) you only get to see local traffic (packets from/to the switch at L2 or L3); (2) not everything might travel the route you think.
In this case, we can clearly see that the switch gets the
who-has (broadcast to ff:ff:ff:ff:ff:ff) and it
replies with is-at.
But, keeping the caveats in mind, I was still only 90% sure the switch wasn't to blame.
(We also see that the size of the who-has differs, but that was likely just padding added by either the sending or receiving hardware.)
In the meantime, traffic to/from the host was working fine. The
difference being that it used the MAC address of the host:
24:8a:07:xx:xx:xx instead of
bc:24:11:xx:xx:xx.
Traffic flow, changes, and usual suspects
In our setup, guests connect to a Linux bridge on the Proxmox host. That bridge is backed by a Mellanox ConnectX-4 Lx NIC and tagged subinterfaces for VLAN separation. Packets should flow like this: VM → Linux bridge → Mellanox NIC (with VLAN tags) → upstream switch.
The Proxmox host had been upgraded, and along with it, the Debian host OS and Linux kernel: from Proxmox 7.2 on Bullseye with kernel 5.15.35-2-pve, to Proxmox 8.4 on Bookworm with kernel 6.8.12-15-pve, and finally Proxmox 9.0 on Trixie with kernel 6.14.11-2-pve.
It was useful that we had installed GoCollect on this host.
It allowed us to look back in time and see what versions of kernels
were running earlier (os.kernel).
Trying to debug the cause for the missing packets, I checked the usual culprits:
- iptables/ebtables/nft — any kind of table I could find, both on the switch and on the host — all empty or irrelevant;
- Bridge and VLAN config — removing the bridge manually, and setting up both the VLAN subinterfaces and the bridge, and the subinterface on the switch;
- FDB weirdness — I tried to find the switch's forwarding tables, but apart from the ip neigh interface — which looked correct — I couldn't find other MAC address tables;
- Forwarding rules — compared the ip_forward settings and synced it with a host that has no problems;
- MAC tricks — chose a fresh VM MAC address;
- VLAN priority — tried to set priority 0
instead of priority 2 (
p 2).
Nothing.
Offloading
During these debug sessions I asked Mr. Chat for advice, and it came up with suggestions like:
# ethtool -K enmlx0 rxvlan off txvlan off gro off gso off
That disables various offloading options in the NIC: this hardware acceleration speeds up traffic handling, but it may hide something. Maybe now the missing packets would appear?
They didn't. And I was ready to give up.

But as they say: de aanhouder wint.
After looking some more at ethtool -k output, the rx-vlan-filter setting caught my eye.
Let's try that.
# ethtool -K enmlx0 rx-vlan-filter off
All connectivity to the host was lost.
According to sources, the networking just needed a “bump”
and would then resume. But no — that setting needed to be
on or we had no connectivity at all.
That shouldn't be the case, so I went looking for firmware upgrades.
Mellanox firmware
On the NVIDIA site, the mlxup tool was easy to
find. And it did exactly what it was supposed to do:
# ./mlxup --query
Querying Mellanox devices firmware ...

Device #1:
----------

  Device Type:      ConnectX4LX
  Part Number:      MCX4121A-ACA_Ax
  Description:      ConnectX-4 Lx EN network interface card; 25GbE dual-port SFP28; PCIe3.0 x8; ROHS R6
  PSID:             MT_2420110034
  PCI Device Name:  0000:81:00.0
  Base MAC:         248a07xxxxxx
  Versions:         Current        Available
     FW             14.16.1020     14.32.1010
     PXE            3.4.0812       3.6.0502
     UEFI           N/A            14.25.0017

  Status:           Update required
That looked promising. Let's update.
# ./mlxup -d 0000:81:00.0
...

Found 1 device(s) requiring firmware update...

Perform FW update? [y/N]: y
About as smooth as a firmware upgrade can get.
And that was it: rx-vlan-filter could now be toggled, and better yet, the guest VM started communicating.
Timeline
So, what must have happened is the following:
- Sometime between kernel 5.15 and kernel 6.8, a new hardware feature in the Mellanox NIC was put to use;
- This feature didn't work on the older firmware;
- But that was fixed after firmware 14.16.1020 and before 14.27.1016 (seen on a working system).
I spent a bit of time trying to find the offending commit, but I didn't want to revert kernels or firmwares. Simply browsing the kernel changes and the (unfortunately very concise) firmware changelog was not sufficient for me to pinpoint the specific changes in both.
I suspect maybe this “[while] using e-switch vport sVLAN stripping, the RX steering values on the sVLAN might not be accurate” firmware fix. And possibly for the kernel one of the “[this] patch series deals with vport handling in SW steering” patches.
Once again, I did learn a lot. Next time a NIC decides to
misbehave, I'll make sure to also probe info using devlink dev
eswitch show pci/0000:81:00.0 and devlink dev param show
pci/0000:81:00.0.
Info gathering and tips
We call our Mellanox NICs enmlx0 and upwards using systemd-networkd .link files. This shortens the name from the stable enp129s0f0 or enp129s0f0np0 names. We do this because there is (still) a 15-character limit on interface names. VLANs can go up to 4095, so a subinterface of enp129s0f0np0.4095 would require 18 characters, and won't fit.
If you're looking for the serial number of your Mellanox
NIC, you can use lspci -vv:
# lspci -vv | sed -e '/^[^[:blank:]].*Mellanox/,/^$/!d;/^[^[:blank:]]\|[[]SN[]]/!d'
81:00.0 Ethernet controller: Mellanox Technologies MT27710 Family [ConnectX-4 Lx]
      [SN] Serial number: MT16xxXxxxxx
81:00.1 Ethernet controller: Mellanox Technologies MT27710 Family [ConnectX-4 Lx]
      [SN] Serial number: MT16xxXxxxxx
If you happen to have all machine info of your fleet — like we do with
GoCollect — the firmware
version can be found in lshw (app.lshw):
# lshw -json | jq 'recurse(.children[]?)
    | select(.vendor == "Mellanox Technologies")
    | .configuration'

{
  "autonegotiation": "on",
  "broadcast": "yes",
  "driver": "mlx5_core",
  "driverversion": "6.14.11-2-pve",
  "firmware": "14.32.1010 (MT_2420110034)",
  "latency": "0",
  "link": "no",
  "multicast": "yes"
}
2025-09-18 - zabbix / wrong nvme temperature readings
After installing some new nodes Zabbix began reporting NVMe drive temperatures that were... alarming. Think "above 60 °C" alarming. But when I checked the same drives manually, the values were sane. So, either the drives were gaslighting me, or Zabbix was.
The search
Decomposing what our monitoring scripts do was really just calling nvme-cli:
# nvme smart-log /dev/nvme0n1 | grep temper
temperature       : 33 °C (306 K)
Nothing wrong there.
Next step was to peek under the hood. I disabled TLS on the zabbix-agent so I could sniff what the proxy was sending and what the agent was replying with.
The config sent by the zabbix-proxy looked fine:
{
  "response": "success",
  "config_revision": 1,
  "data": [
// ...
    {
      "key": "nvme.device.smart[/dev/nvme1n1,temperature]",
      "itemid": 3436251,
      "delay": "1h",
      "lastlogsize": 0,
      "mtime": 0,
      "timeout": "4s"
    },
// ...
The data sent by the zabbix-agent also looked fine, except for the extreme temperature:
{
  "request": "agent data",
  "session": "cf1f77a2de59226b9edac3a4d68af46f",
  "version": "7.0.18",
  "variant": 1,
  "host": "pve.example.com",
  "data": [
    {
      "itemid": 3436250,
      "value": "91",
      "id": 201,
      "clock": 1758189607,
      "ns": 650994625
    },
// ...
Again, I double-checked the configuration and the script:
# grep -F =nvme.device.smart /etc/zabbix/zabbix_agentd.d/nvme.conf
UserParameter=nvme.device.smart[*], sudo /etc/zabbix/scripts/nvme.device --smart "$1" "$2"
# sudo -Huzabbix sudo /etc/zabbix/scripts/nvme.device --smart /dev/nvme0n1 temperature
33
I then modified the script to report the constant value 66.
{
  "request": "agent data",
  "session": "cf1f77a2de59226b9edac3a4d68af46f",
  "version": "7.0.18",
  "variant": 1,
  "host": "pve.example.com",
  "data": [
    {
      "itemid": 3436250,
      "value": "66",
      "id": 201,
      "clock": 1758189788,
      "ns": 110298321
    },
// ...
The zabbix-agent dutifully reported the 66 back to the proxy. So then nvme-cli must be telling a different story.
At that point I suspected the environment. I modified the
script to dump the env to a temporary file:
env >/tmp/zabbix.debug
After the next zabbix-agent run, I found the /tmp/zabbix.debug file with the exact environment with which nvme-cli would be called.
A alternative approach is to to run strace, which produced the following output:
# strace -fp $(pgrep -f 'zabbix_agentd: active checks') -v -s 4096 -es=none -eq=exit -et=execve
...
[pid 3483848] execve("/bin/sh",
  ["sh", "-c", " sudo /etc/zabbix/scripts/nvme.device --smart \"/dev/nvme0n1\" \"temperature\""],
  ["LANG=en_US.UTF-8",
   "PATH=/usr/local/sbin:/usr/local/bin:/usr/sbin:/usr/bin",
   "PIDFILE=/run/zabbix/zabbix_agentd.pid",
   "USER=zabbix",
   "LOGNAME=zabbix",
   "HOME=/var/lib/zabbix",
   "INVOCATION_ID=1c74972630de492aa275f3d8c19f9f65",
   "JOURNAL_STREAM=9:69398932",
   "SYSTEMD_EXEC_PID=3483398",
   "MEMORY_PRESSURE_WATCH=/sys/fs/cgroup/system.slice/zabbix-agent.service/memory.pressure",
   "MEMORY_PRESSURE_WRITE=c29tZSAyMDAwMDAgMjAwMDAwMAA=",
   "CONFFILE=/etc/zabbix/zabbix_agentd.conf"]) = 0
The third parameter is the list of environment variables passed to the custom script. They don't look strange at first glance — but they must be the cause.
At this point, the astute reader will notice
LANG=en_US.UTF-8. That is passed to the script,
and consequently to the nvme-cli application.
LANG=en_US.UTF-8
Indeed, it turned out that the LANG variable was the culprit. Adding
LC_ALL=en_US.UTF-8 (forcefully overriding any language settings), exhibited the
problem:
# nvme smart-log /dev/nvme0n1 | grep ^tempera
temperature       : 33 °C (306 K)
# LC_ALL=en_US.UTF-8 nvme smart-log /dev/nvme0n1 | grep ^tempera
temperature       : 91 °F (306 K)
91 Fahrenheit instead of 33 Celsius from nvme-cli.
Here in the Netherlands we don't measure temperatures in
glazed donuts per bald eagle units, so I had my system locales
set to a sane mix of nl_NL and en_US:
# locale
LANG=en_US.UTF-8
LANGUAGE=
LC_CTYPE="en_US.UTF-8"
LC_NUMERIC=en_US.UTF-8
LC_TIME=nl_NL.UTF-8
LC_COLLATE="en_US.UTF-8"
LC_MONETARY=nl_NL.UTF-8
LC_MESSAGES="en_US.UTF-8"
LC_PAPER=nl_NL.UTF-8
LC_NAME=nl_NL.UTF-8
LC_ADDRESS=nl_NL.UTF-8
LC_TELEPHONE=nl_NL.UTF-8
LC_MEASUREMENT=nl_NL.UTF-8
LC_IDENTIFICATION=nl_NL.UTF-8
LC_ALL=
That's my personal config passed along over the ssh session.
On the server the zabbix-agent simply inherits LANG=en_US.UTF-8 from systemd:
# systemctl show-environment
LANG=en_US.UTF-8
PATH=/usr/local/sbin:/usr/local/bin:/usr/sbin:/usr/bin
This is not a new config. On this Debian/Trixie machine, the
defaults are configured in /etc/locale.conf. In older
systems, it would be in /etc/default/locale. Systemd
picks up either config and uses it when spawning daemons.
And because we like to keep our servers close to vanilla config and because we prefer English for our systems, there is never a need to change the global default locale.
Sidenote: if you're updating
/etc/default/localeor/etc/locale.conf, runsystemctl daemon-reexecto update the environment in systemd.
nvme-cli updated
To summarize, the newer nvme-cli application started outputting temperatures in Fahrenheit instead of Celsius when your locale country is "US" (or a handful others).
That change was made in version v2.10:
$ git tag --contains c95f96e0d | sort -V | head -n1
v2.10
Debian/Trixie has 2.13-2 while Ubuntu/Noble is still at 2.8-1ubuntu0.1; explaining why this was the first time we were bitten by this.
There were apparently already others affected, as seen on the GitHub issue tracker,
and there was also some confusion
about LC_MEASUREMENT=metric.
That's wrong. Set it to a valid locale, like LC_MEASUREMENT=nl_NL.UTF-8.
To programmers: if you really must, use the following C code when deciding to use Fahrenheit, instead of rolling your own is_fahrenheit_country():
const char *m = nl_langinfo(_NL_MEASUREMENT_MEASUREMENT);
if (m && m[0] == 2) {
    printf("Fahrenheit\n");
} else { /* m[0] == 1 or anything else */
    printf("Celsius\n");
}
But, I'd rather you didn't. The default of en_US is fine as long as it's unobtrusive. If you're going to change your code, expect that people use the default and don't expect (or want) your change.
Proper fix
In the long run, it might be better to force zabbix-agent to
lose the locale environment altogether. It would make the most sense
when custom zabbix-agent scripts get the C locale
for consistent sorting (and consistent temperature output). That
requires some external influence (for instance a systemd
Environment= override. So for now I'll stick to adding it
where
needed.
Update 2025-11-03
In the end, the dynamic detection was removed from nvme-cli. Instead now three temperature units are always shown, regardless of locale settings.
So, we're back to the situation where plenty of applications read
LC_PAPER, but none use LC_MEASUREMENT.
2025-07-06 - loopback through leaf / single nic iperf test
When bringing up new servers, especially with new or untested network interface cards (NICs) or cables, you might want to test their raw network throughput. While standard iperf tests between two different machines are common, sometimes you want to isolate the test to a single NIC, pushing traffic through it and back, effectively looping it at a nearby switch. This verifies the physical path, the SFP, and the NIC's transmit/receive capabilities without involving another server's NIC or network stack.
The challenge, however, is that an iperf server and client
running on the same host will typically use the internal loopback interface
(lo) for communication, never touching the physical NIC.
We need to trick the Linux network stack into routing traffic out
of the specific NIC and then back in to reach the iperf
server on the same machine. This is where ip rule and
policy-based routing come in.
The Scenario: Looping iperf on enp1s0f0np0
Imagine you have a server with a NIC named enp1s0f0np0
that you want to test. It's connected to a layer-3 switch.
We'll set up a dedicated, isolated IP address on this NIC and use
ip rule to ensure traffic to that address always leaves and
re-enters via enp1s0f0np0.
The Initial State: Default Routing Policy
Before we begin, a quick look at the default IP routing policy on a typical Linux host:
# ip -d rule show
0:      from all lookup local proto kernel
32766:  from all lookup main proto kernel
32767:  from all lookup default proto kernel
This shows the standard lookup order: first, the local
table (for local addresses), then main (your primary routing table),
and finally default (a fallback). Our goal is to insert rules before
local that force our specific iperf traffic to use a custom route.
Step 1: Configuring the neighbour switch
This may or may not be needed, depending on your setup. If you already have a valid address configured on your host, you might get away with using that. You will need to replace the IP-addresses in the example configurations below.
On a Cumulus switch, configuring a link-local test network with two IPs might look like:
# net add interface swp1 ip address 169.254.101.0/31
# net comm
Here, swp1 is the switch port connected to enp1s0f0np0.
I chose the 169.254.0.0/16 link-local subnet because these addresses are
made for exactly this purpose.
We're handing out 169.254.101.1 to the host and 169.254.101.0 to the switch. You're free to choose anything you like. You can even just re-use any currently configured IP. Make sure you replace the host and gateway IPs in the commands below though.
Step 2: Configuring the Host NIC and Routing Policy
Now for the magic on the host. We'll add the corresponding IP address to our NIC and then, crucially, define a new routing table and rules to direct traffic through it.
Add the host IP to the NIC:
# ip addr add 169.254.101.1/31 dev enp1s0f0np0
Create a custom routing table (table 169) for our looped traffic.
This says: to reach 169.254.101.1, go via 169.254.101.0 (the switch's IP)
out of enp1s0f0np0.
# ip route add 169.254.101.1/32 via 169.254.101.0 \
    dev enp1s0f0np0 table 169
Policy-based routing rule 1: Prioritize traffic
from our test IP
entering enp1s0f0np0 to be handled by the
local table. This is for the return traffic.
# ip rule add prio 169 from 169.254.101.1 \
    iif enp1s0f0np0 lookup local
Policy-based routing rule 2: Prioritize traffic
to our test IP to use our custom table 169.
This forces
outgoing traffic destined for ourselves to go via the switch.
# ip rule add prio 170 from 169.254.101.1 to 169.254.101.1 lookup 169
Policy-based routing rule 3: This is a critical adjustment.
The default from all lookup local rule (prio 0)
would catch our 169.254.101.1 address and loop it internally.
We need to make sure our custom rules come before it.
The trick here is to insert a new lookup local rule with a higher
priority and then delete the old prio 0 rule.
This effectively re-prioritizes the local lookup:
# ip rule add prio 171 from all lookup local proto kernel
# ip rule del prio 0 from all lookup local
The Result: A Tailored Routing Policy
After these changes, your routing policy (ip rule show)
and tables (ip route show, ip route show table
169) should look something like this:
# ip -d rule show
169:    from 169.254.101.1 iif enp1s0f0np0 lookup local proto unspec
170:    from all to 169.254.101.1 lookup 169 proto unspec
171:    from all lookup local proto kernel
32766:  from all lookup main proto kernel
32767:  from all lookup default proto kernel
# ip route show
default via 10.20.30.1 dev enp1s0f0np0
10.20.30.0/24 dev enp1s0f0np0 proto kernel scope link src 10.20.30.44
169.254.101.0/31 dev enp1s0f0np0 proto kernel scope link src 169.254.101.1
# ip route show table 169
169.254.101.1 via 169.254.101.0 dev enp1s0f0np0
Notice how ip rule now ensures that any traffic to
169.254.101.1 goes through lookup 169, forcing it out
enp1s0f0np0 via 169.254.101.0 (the switch).
When it comes back, ip rule prio 169 ensures traffic from
169.254.101.1 on interface enp1s0f0np0 is
handled locally. This is key to bypass the standard loopback.
The 10.20.30.44 is just a sample IP that may or may not be configured on your host.
A quick test, comparing the link-local IP to localhost:
# ping -I 169.254.101.1 169.254.101.1
PING 169.254.101.1 (169.254.101.1) from 169.254.101.1 : 56(84) bytes of data.
64 bytes from 169.254.101.1: icmp_seq=1 ttl=63 time=0.578 ms
64 bytes from 169.254.101.1: icmp_seq=2 ttl=63 time=0.538 ms
^C
# ping localhost
PING localhost (127.0.0.1) 56(84) bytes of data.
64 bytes from localhost (127.0.0.1): icmp_seq=1 ttl=64 time=0.015 ms
64 bytes from localhost (127.0.0.1): icmp_seq=2 ttl=64 time=0.025 ms
^C
The successful ping -I 169.254.101.1 169.254.101.1
with measurable latency and ttl of 63 confirms the
traffic is indeed leaving and re-entering the enp1s0f0np0
interface.
Running iperf
With the routing in place, running iperf is straightforward.
On the server, start iperf binding to our test IP:
# iperf -B 169.254.101.1 -s
On the client (the same machine!), connect to the server using the test IP:
# iperf -B 169.254.101.1 -c 169.254.101.1 -t 15 -i 5
The -B flag ensures iperf binds to our chosen IP address
for its traffic, which our ip rule configuration will then intercept
and route correctly. You can now observe the throughput directly
through your target NIC.
This method provides a robust way to isolate and thoroughly test a single NIC's performance by forcing traffic through the physical layer, giving you confidence in your new hardware or setup.
Update 2026-06-16
The post has been edited to restrict ip rule 170 a bit further so it doesn't interfere with internet connectivity.
A utility script to make it easier to (temporarily) deploy can be found in ossobv/vcutil: iperfplan
Update 2026-07-15
Clarified that we need proto kernel on the moved
"lookup local" rule to avoid running into systemd-networkd
removing rules.
2025-05-31 - invalid elf header magic / rook-ceph / k8s
Yesterday, we noticed some previously unseen messages in the logs: Invalid ELF header magic: != \x7fELF. Of course an ELF binary should start with a valid header. Who/what is trying to run something else?
These messages appeared on Kubernetes nodes that were recently installed and not yet fully in use for production workloads. Coincidentally, these particular nodes were running Ubuntu 24.04 (Noble Numbat), while the rest of this cluster was still on older versions.
Yes, we're already well into 2025. Upgrading from Jammy (22.04) to Noble (24.04) has been less pain-free than the upgrade from Focal (20.04) to Jammy (22.04), so we are a bit behind. If others have been slow to upgrade as well, that might explain why so many new application bugs turn up this late.
In dmesg the “Invalid ELF” message was clear and readable. In journalctl it reads [33B blob data]:
# journalctl -S '2025-05-30 11:00' --grep 'ELF'
mei 30 11:00:25 noble.example.com kernel: [33B blob data]
mei 30 11:05:30 noble.example.com kernel: [33B blob data]
mei 30 11:10:41 noble.example.com kernel: [33B blob data]
journalctl makes sure no unprintable garbage goes to the screen — in this case the \x7f. But that replacement replaces everything, including the printable ASCII.
Now that I knew what log line to look for, I checked surrounding log lines.
There, in the middle, there's the kernel: [33B blob
data]. Before it, containerd shows that a container is
started:
kubelet[1605]: I0530 11:05:30.172379 1605 scope.go:117]
"RemoveContainer" containerID="<id>"
containerd[1717]: time="2025-05-30T11:05:30.173674804+02:00" level=info
msg="CreateContainer within sandbox \"<id>\" for container &ContainerMetadata{Name:csi-rbdplugin,Attempt:853,}"
containerd[1717]: time="2025-05-30T11:05:30.182002680+02:00" level=info
msg="CreateContainer within sandbox \"<id>\" for &ContainerMetadata{Name:csi-rbdplugin,Attempt:853,} returns container id \"<id>\""
containerd[1717]: time="2025-05-30T11:05:30.182178318+02:00" level=info
msg="StartContainer for \"<id>\""
ctre[1581]: C 1748595930 k8s.io quay.io/cephcsi/cephcsi:v3.8.0
systemd[1]: Started cri-containerd-<id>.scope - libcontainer container <id>.
containerd[1717]: time="2025-05-30T11:05:30.218713573+02:00" level=info
msg="StartContainer for \"<id>\" returns successfully"
ctre[1581]: T 1748595930 k8s.io quay.io/cephcsi/cephcsi:v3.8.0
kernel: [33B blob
  data]
systemd[1]: cri-containerd-<id>.scope: Deactivated successfully.
containerd[1717]: time="2025-05-30T11:05:30.258058437+02:00" level=info
msg="received exit event container_id:\"<id>\" id:\"<id>\" pid:1942336 exit_status:255 exited_at:{seconds:1748595930 nanos:257930298}"
ctre[1581]: t 1748595930 k8s.io quay.io/cephcsi/cephcsi:v3.8.0
systemd[1]: run-containerd-io.containerd.runtime.v2.task-k8s.io-<id>-rootfs.mount: Deactivated successfully.
containerd[1717]: time="2025-05-30T11:05:31.547087240+02:00" level=info
msg="shim disconnected" id=<id> namespace=k8s.io
containerd[1717]: time="2025-05-30T11:05:31.547113810+02:00" level=warning
msg="cleaning up after shim disconnected" id=<id> namespace=k8s.io
containerd[1717]: time="2025-05-30T11:05:31.547119691+02:00" level=info
msg="cleaning up dead shim" namespace=k8s.io
kubelet[1605]: I0530 11:05:32.203748 1605 scope.go:117] "RemoveContainer" containerID="<id>"
ctre sidenote
There's also a ctre application log in there:
ctre[1581]: T 1748595930 k8s.io quay.io/cephcsi/cephcsi:v3.8.0
ctre is our custom tool that keeps track of the starting and stopping of images in containerd.
Docker and Kubernetes tend to accumulate lots of old images in containerd. These unused images aren't just disk space hogs; they can also degrade the performance of the underlying ZFS filesystem. We needed a smarter way to prune.
While common methods like crictl prune aggressively clear everything
they can (barring currently in-use images), this isn't always ideal.
Imagine a periodic cron job relying on a large image; if it's pruned every time the job isn't running, the image has to be downloaded anew for the next execution.
ctre addresses this by recording image usage timestamps.
Our nightly ctre prune then selectively keeps images likely to be reused,
while purging those that haven't seen recent activity.
When looking at the logs, this log line provided an additional hint as to the problem's source.
bpftrace to find the execve
The “Invalid ELF” errors were appearing in the logs regular
as clockwork, so a good
place to start seemed to be to look for any execve() calls.
Maybe a non-zero return value would point us right to the culprit.
bpftrace deserves a blog post of its own. One thing it can do, is do strace-like functionality, but for all processes. Instead of strace -e execve on a single application, I do this:
# bpftrace -e '
tracepoint:syscalls:sys_enter_execve
{
  printf("%s.%d [%d] execve (%s) ", strftime("%H:%M:%S", nsecs), nsecs % 1000000000, pid, comm);
  join(args->argv);
}'

tar (child): xz: Cannot exec: No such file or directory
...
11:46:40.231050035 [2826375] execve (zfs-driver) zfs list -d 1 -s name -o name,guid,available,used -H -p
11:46:40.231597246 [2826376] execve (zfs) chroot /host /sbin/zfs list -d 1 -s name -o name,guid,available,used -H -p
...
This will show all execve() calls happening on the system.
You can safely ignore that xz: Cannot exec. But if you want to get rid of it, see the tips in the bpftrace-deb README:
Another thing to note is the comm — the argument between parentheses like (zfs-driver) — which looks like the parent process. And that is not because it is the parent but because the parent forked/cloned itself before becoming the new process: when your bash shell invokes a new process, it first fork()s so there is a bash parent and a bash child. The child then uses execve() to become the new process. The bpftrace log shows the moment just before the transition. That explains that comm looks like the parent.
The log messages were generally about 5 minutes apart, so I didn't have to wait long for the next message to appear. And indeed, I didn't have to wait very long. The log listed the next error:
[vr mei 30 11:46:40 2025] Invalid ELF header magic: != \x7fELF
And around that time, these suspicious looking execve calls were made.
11:46:40.231597246 [2826376] execve (sh) modprobe rbd
11:46:40.231597246 [2826376] execve (sh) umount
csi-rbdplugin in CrashLoopBackoff
That reminds me, I did see some csi-rbdplugin rook-ceph
Kubernetes pods in CrashLoopBackOff state.
That was no coincidence. All failing pods were on the new Noble nodes. The pods running on Jammy were fine.
I ran modprobe rbd manually on the node and waited for the next cycle.
11:51:44.533278002 [2826376] execve (sh) modprobe nbd
I imported the nbd module as well. Now the all the pods started successfully, and the ELF error disappeared from the logs.
Old modprobe on new system
Now everything fell into place: during initialization, the ceph pods try to load rbd and nbd modules. But on the newer systems they couldn't.
First, let's look at the modprobe version on the host system:
root@noble.example.com# modprobe --version
kmod version 31
+ZSTD +XZ -ZLIB +LIBCRYPTO -EXPERIMENTAL
Next, the modprobe version inside the quay.io/cephcsi/cephcsi:v3.8.0 image:
sh-4.4# modprobe --version
kmod version 25
+XZ +ZLIB +OPENSSL -EXPERIMENTAL
Here's the critical difference. Previously, on the older Jammy systems, the kernel modules were not compressed:
root@jammy.example.com# find /lib/modules/$(uname -r) -name rbd*
/lib/modules/5.15.0-116-generic/kernel/drivers/block/rbd.ko
But now, on the Noble systems, they were compressed with ZSTD:
root@noble.example.com# find /lib/modules/$(uname -r) -name rbd*
/lib/modules/6.8.0-60-generic/kernel/drivers/block/rbd.ko.zst
To confirm the kmod incompatibility directly from within the container, I did a quick test:
sh-4.4# cat /etc/os-release
NAME="CentOS Stream"
VERSION="8"
ID="centos"
ID_LIKE="rhel fedora"
sh-4.4# find /lib/modules/6.8.0-60-generic/ -name ipta*
/lib/modules/6.8.0-60-generic/kernel/net/ipv4/netfilter/iptable_raw.ko.zst
/lib/modules/6.8.0-60-generic/kernel/net/ipv4/netfilter/iptable_security.ko.zst
/lib/modules/6.8.0-60-generic/kernel/net/ipv4/netfilter/iptable_filter.ko.zst
/lib/modules/6.8.0-60-generic/kernel/net/ipv4/netfilter/iptable_nat.ko.zst
/lib/modules/6.8.0-60-generic/kernel/net/ipv4/netfilter/iptable_mangle.ko.zst
sh-4.4# modprobe iptable_nat
modprobe: ERROR: could not insert 'iptable_nat': Exec format error
[vr mei 30 12:36:09 2025] Invalid ELF header magic: != \x7fELF
Yes, that test confirms that modprobe was the culprit. The older kmod version (25) inside the container does not cope with the ZST compressed kernel modules found on the Noble host. Manually preloading the rbd and nbd modules on the nodes was the easiest fix for now.
Technical nuance
While I was initially looking to blame an execve call for directly
triggering the “Invalid ELF header magic” error, it turns out that's
not strictly possible. An execve call attempting to run something
that is not a valid binary will typically return ENOEXEC (8)
with the message “Exec format error” to the calling
process. No kernel error would be logged.
The kernel error we observed is actually only triggered internally by the kernel during a module load failure. This can be seen in the kernel source code for module loading:
/*
 * Check userspace passed ELF module against our expectations, and cache
 * useful variables for further processing as we go.
...
 */
static int elf_validity_cache_copy(struct load_info *info, int flags)
{
// ...
        if (memcmp(info->hdr->e_ident, ELFMAG, SELFMAG) != 0) {
                pr_err("Invalid ELF header magic: != %s\n", ELFMAG);
                goto no_exec;
However, tracing the execve calls was still crucial as it directly pointed me to modprobe as the culprit process. So, while the initial assumption about the direct trigger mechanism was slightly off, the debugging tactic was ultimately effective.
2025-05-30 - nginx / no realip in logs / bug
Recently we were doing a vulnerability scan on an external endpoint of a website. During this time, we noticed simultaneous suspicious activity coming from inside our internal network. What's the deal?
To make a long story short: we use a proxy (like HAProxy) in front of our webservers, and it speaks the Proxy Protocol to pass along the original client's IP address. That way, when a request hits our internal nginx server, the logs show the real client's IP, not the IP of the reverse proxy that actually made the connection.
But during our scan, some failed requests showed up in the logs with the proxy's IP address — not the external client's. This made us pause: “Wait… is someone inside our network scanning this site too?”
We figured it out quickly, but it was still unsettling. And in our view, this is a bug.
Reproducing
Step one: fetch the latest nginx.
$ git clone https://github.com/nginx/nginx
...
Configure and build it:
$ ./auto/configure --with-debug --with-http_realip_module
...
$ make -j$(nproc)
...
$ ./objs/nginx -V
nginx version: nginx/1.29.0
built by gcc 11.4.0 (Ubuntu 11.4.0-1ubuntu1~22.04)
configure arguments: --with-http_realip_module
Set up a basic config in ./conf/nginx_realip_bug.conf:
worker_processes  1;
error_log stderr info;

events {
    worker_connections  1024;
}

http {
    include       mime.types;
    default_type  text/plain;

    set_real_ip_from  127.0.0.0/8;
    real_ip_header    proxy_protocol;

    access_log /dev/stderr;

    server {
        listen       8080 proxy_protocol_always;
        server_name  localhost;
        location / {
            return 200 "Hello world\n";
        }
    }
}
Run nginx in the foreground:
$ ./objs/nginx -p $PWD -c conf/nginx_realip_bug.conf -g 'daemon off;'
2025/05/29 22:59:23 [notice] 154902#0: using the "epoll" event method
2025/05/29 22:59:23 [notice] 154902#0: nginx/1.29.0
2025/05/29 22:59:23 [notice] 154902#0: built by gcc 11.4.0 (Ubuntu 11.4.0-1ubuntu1~22.04)
...
Do a simple request:
$ printf '%s\r\n' \
    'PROXY TCP4 1.2.3.4 127.127.127.127 80 8080' \
    'GET /foo HTTP/1.0' '' |
    nc 127.0.0.1 8080 -w2

HTTP/1.1 200 OK
Server: nginx/1.29.0
Date: Fri, 30 May 2025 19:36:40 GMT
Content-Type: text/plain
Content-Length: 12
Connection: close

Hello world
This could use some explanation. The GET /foo HTTP/1.0
is the oldest/most basic HTTP request, followed by two sets of CR LF.
The printf '%s\r\n' provides those.
We could have used
curl --path-as-is --haproxy-protocol
    localhost:8080/foo
, instead of theprintfandnccombination. But curl doesn't let us set values (like 1.2.3.4), and for this example we need them to be visibly different.
The location / in the configuration accepts everything
below / — like /foo —
and returns a 200 OK status code and the Hello
world message.
Proxy protocol
The Proxy Protocol — originally proposed by Willy Tarreau — is a simple way to preserve information about the real client when traffic passes through one or more proxies.
Shown here is the v1 version:
PROXY TCP4 1.2.3.4 127.127.127.127 80 8080
This line tells the receiving server that the original IPv4 client (1.2.3.4) is connecting to the destination IP (127.127.127.127) — from port 80 to port 8080. A reverse proxy injects this line at the start of the connection, so the upstream (or "origin") server can see who actually made the request, even though it's technically connected to the proxy.
Yes, HTTP has X-Forwarded-For, but that header is less reliable: it depends on careful trust boundaries, can be spoofed, and is harder to manage across non-HTTP protocols.
This is all explained in detail at proxy-protocol.txt.
We use reverse proxies to protect our internal network from the big bad internet. But for the machines behind those proxies, the Proxy Protocol is how they know who's really knocking.
Real IP in logs
With the provided nginx config, the first GET
/foo from above shows up in the logs as:
1.2.3.4 - - [30/May/2025:21:36:40 +0200] "GET /foo HTTP/1.0" 200 12 "-" "-"
Let's do another request, with the funky, but somewhat legal, /foo/../foo path:
$ printf '%s\r\n' \
    'PROXY TCP4 1.2.3.4 127.127.127.127 80 8080' \
    'GET /foo/../foo HTTP/1.0' '' |
    nc 127.0.0.1 8080 -w2

HTTP/1.1 200 OK
Server: nginx/1.29.0
Date: Fri, 30 May 2025 19:36:57 GMT
Content-Type: text/plain
Content-Length: 12
Connection: close

Hello world
We still get a 200 status. And this log line:
1.2.3.4 - - [30/May/2025:21:36:57 +0200] "GET /foo/../foo HTTP/1.0" 200 12 "-" "-"
So far so good. Now make it worse by trying to escape from the root
path with /foo/../../foo:
$ printf '%s\r\n' \
    'PROXY TCP4 1.2.3.4 127.127.127.127 80 8080' \
    'GET /foo/../../foo HTTP/1.0' '' |
    nc 127.0.0.1 8080 -w2

HTTP/1.1 400 Bad Request
Server: nginx/1.29.0
Date: Fri, 30 May 2025 19:37:11 GMT
Content-Type: text/html
Content-Length: 157
Connection: close

<html>
<head><title>400 Bad Request</title></head>
<body>
<center><h1>400 Bad Request</h1></center>
<hr><center>nginx/1.29.0</center>
</body>
</html>
Boom! Rejected. That's okay. That's good in fact.
Proxy IP in logs
And the logs?
2025/05/30 21:37:11 [info] 175878#0: *3 client sent invalid request while reading client request line, client: 127.0.0.1, server: localhost, request: "GET /foo/../../foo HTTP/1.0"
127.0.0.1 - - [30/May/2025:21:37:11 +0200] "GET /foo/../../foo HTTP/1.0" 400 157 "-" "-"
Two log lines this time. But here's the problem: they show the proxy's IP (127.0.0.1) instead of the real client IP (1.2.3.4). Not nice.
There's a simple technical reason. nginx rejects the malformed request before any modules get a chance to run — including the realip module that rewrites IP addresses.
This isn't limited to bad HTTP requests either. TLS handshake errors and other early-stage failures can also bypass the modules, leading to the same issue: logs that show the proxy's IP instead of the real one.
But just because there's an explanation doesn't mean it's okay.
Bug filed at nginx/nginx#717.
Let's see what upstream has to say.
2025-05-29 - supermicro / ikvm / expired certificate
Supermicro computers generally work very well. At our company we've been using them for ages. One thing that does keep giving us the occasional trouble however is the BMC. Today, we'll be looking at expired certificates of the iKVM interface.
Introduction
First, some definitions, which we generally use interchangeably:
The Baseboard Management Controller (BMC) is the chipset core of the Intelligent Platform Management Interface (IPMI) implementation, which we mostly use to remotely attach a Keyboard, Video and Mouse (KVM, over IP).
iKVM — for IP-KVM or IPMI-KVM? — is the Java implementation that comes with the Supermicro BMC Firmware. The Supermicro BMC Interface (or IPMI) provides access to the KVM via either a HTML interface or via its iKVM Java application.
The use case for IPMI KVM access is when we've lost, or never had, regular ssh or vpn access to a remote server. Often you'll want more than just a keyboard; you also want to attach a virtual CD-ROM or USB-drive to get access to installation/recovery tools.
The HTML interface does not provide the capability to mount a virtual drive. The Java application does. So, we prefer working with that one. We'll be calling that iKVM, and BMC will refer to the hardware, firmware and the web interface of the Supermicro IPMI.
(Note that the Java application is dated and buggy, but with the right tools (vcutil ipmikvm and xpaste) it's usable.)
As mentioned, the Supermicro BMC and iKVM have been a recurring item in my notes to self section, all the way back to 2016:
- 2016-10-25 - A better way of packaging iKVM
- 2020-02-12 - Using the ipmikvm wrapper to launch iKVM
- 2021-06-17 - iKVM TLS issues caused by a wrong clock
- 2022-09-09 - Getting video to work on a Supermicro X9DRW BMC
That issue with the inaccurate BMC clock was a particularly insidious one: the clock was set in the past, causing it to reject TLS connections from iKVM because it considered the TLS certificate not yet valid. But it was hard to debug because the server side did the rejection and only provided an uninformative status code.
Today, there's another “fun” one, also related to certificates and time.
Retry =10 (Connection failed)
There was a connectivity problem on a machine and we needed get KVM access.
No biggie! Just run vcutil ipmikvm.
$ ipmikvm 10.10.10.10
attempting login on '10.10.10.10' with user ADMIN
...
+ exec java -Djava.library.path=.local/lib/ipmikvm/iKVM__V1.69.42.0x0 -cp ...

connect failed sd:16
Retry =1
Retry =2
Retry =3
Retry =4
Retry =5
Retry =6
Retry =7
Retry =8
Retry =9
Retry =10
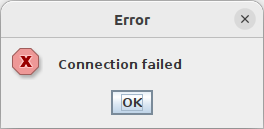
Okay, that's not good. Generally we get about one to three retries and then it works.
We could log into the web interface after clicking past the self-signed and expired certificate warning:
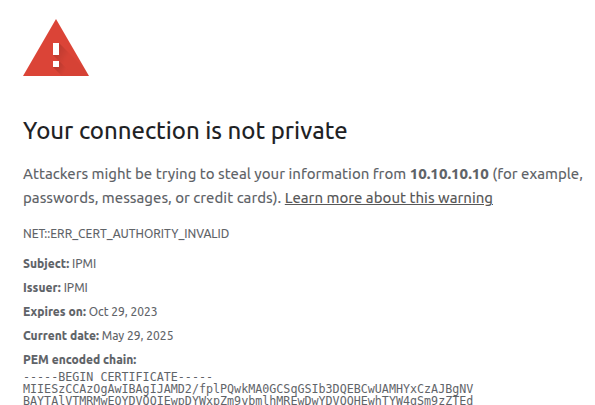
In the web interface we could use the HTML interface to the KVM and the power buttons. But using iKVM would consistently fail.
Expired certificate
A few moments of debugging later, and the expired certificate was assigned blame:
$ easycert -T 10.10.10.10 443
Certificate chain
 0 s: {1B:29:EF:3D:CA:7B:26:2D:A0:AE:AA:71:39:E9:5C:91:0C:C1:28:A8} [9adfe6f5] C = US, ST = California, L = San Jose, O = Super Micro Computer, OU = Software, CN = IPMI
   i: {1B:29:EF:3D:CA:7B:26:2D:A0:AE:AA:71:39:E9:5C:91:0C:C1:28:A8} [9adfe6f5] C = US, ST = California, L = San Jose, O = Super Micro Computer, OU = Software, CN = IPMI
---
Expires in -578 days
vcutil easycert is a quick and easy wrapper around the openssl CLI to check certificate chains and expiry. As you can see, it shows that the certificate is (a) self-signed and (b) expired 578 days ago.
On the https port 443, the certificate had expired almost two years ago. Doing the same check on the main iKVM port 5900:
$ easycert -T 10.10.10.10 5900
Certificate chain
 0 s: {BF:00:C8:10:AC:B2:58:E9:E7:4A:D9:7E:06:A2:DB:79:F6:3B:8F:38} [9adfe6f5] C = US, ST = California, L = San Jose, O = Super Micro Computer, OU = Software, CN = IPMI
   i: {BF:00:C8:10:AC:B2:58:E9:E7:4A:D9:7E:06:A2:DB:79:F6:3B:8F:38} [9adfe6f5] C = US, ST = California, L = San Jose, O = Super Micro Computer, OU = Software, CN = IPMI
---
Expires in -578 days
Exactly the same. Only the X509v3 Subject Key Identifier was different. (Insert foreshadowing here.)
I tried to update the certificate in the web interface. The openssl command to create fresh certificate with the same subject and encryption algorithm:
$ openssl req -x509 -nodes -days 3650 -newkey rsa:2048 \
    -keyout ipmi-priv.pem -out ipmi-pub.pem \
    -subj '/C=US/ST=California/L=San Jose/O=Super Micro Computer/OU=Software/CN=IPMI'
...
In the BMC web interface, the Date and Time were set correctly this time. And in the Configuration > Network > SSL Certificates there's a form to upload the freshly generated certificates.
After uploading them, the web certificate was not updated yet. This required a BMC reset located through Maintenance > BMC Reset > Unit Reset. The reset took more than a minute, but afterwards, the certificate on port 443 was updated to the freshly generated one. Good.
$ easycert -T 10.10.10.10 443
Certificate chain
 0 s: {B6:52:AB:9A:A1:C4:67:9C:8F:40:FF:C3:A8:75:78:8D:85:7F:6B:22} [9adfe6f5] C = US, ST = California, L = San Jose, O = Super Micro Computer, OU = Software, CN = IPMI
   i: {B6:52:AB:9A:A1:C4:67:9C:8F:40:FF:C3:A8:75:78:8D:85:7F:6B:22} [9adfe6f5] C = US, ST = California, L = San Jose, O = Super Micro Computer, OU = Software, CN = IPMI
---
Expires in 3649 days
But unfortunately, the certificate on port 5900 wasn't. It still showed the same expired certificate.
I tried — in vain — to run ipmikvm again, but as expected, it failed with the same Retry =10 and Connection failed messages.
Updating firmware
Next, I did some frantic Googling and ChatGPTing to find another button/option to update the certificates, but the general concensus was that on this board, the TLS certificates were baked into the BMC firmware and could not be independently updated.
Supermicro lists on its downloads page that you shouldn't update the BMC firmware unless you really really have to:
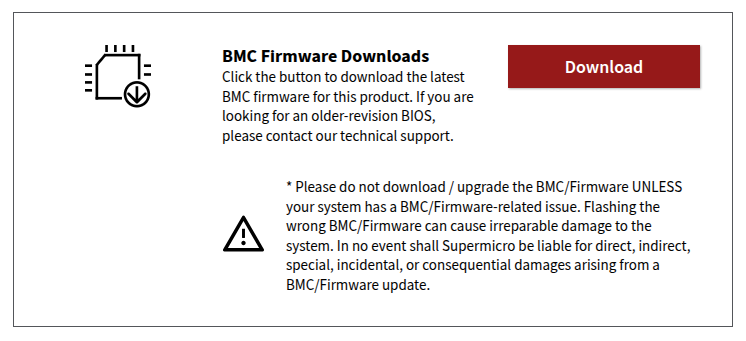
But, I do want iKVM to work again. Let's find the right firmware. Start out by figuring out what hardware we're dealing with:
# for x in system-manufacturer system-product-name \
           baseboard-manufacturer baseboard-product-name
  do printf '%-24s: %s\n' "$x" "$(dmidecode -s $x)"; done

system-manufacturer     : S3S
system-product-name     : AS -1114S-WN10RT
baseboard-manufacturer  : Supermicro
baseboard-product-name  : H12SSW-NTR
Google turns up this AS-1114S-WN10RT which seems plausible, especially since it speaks of the H12SSW-NTR motherboard. It has two downloads available:
BIOS / BMC / Bundle Firmware for AS-1114S-WN10RT and BIOS / BMC / Bundle Firmware for AS-1114S-WN10RT.
Oh wait, that's the same download. I want to update the BIOS even less than I want to update the BMC. And it also mentions that updating needs to be done via the EFI shell, which requires the system to be rebooted, which I also don't want.
Is there another way?
Faking the time
So, as far as I understand, the trouble is that a component in the iKVM application validates the certificate expiry time. This could be inside the bundled Java application, or in an auxiliary application like stunnel.
In any case, unlike the earlier issues where iKVM was rejected due to the BMC clock being set incorrectly, this problem looks to be client side. And on the client, we have control. Like control over the “current time”.
Mr. Chat, whip me up a quick LD_PRELOAD shared libary that fakes the time being 2 years in the past.
In mere seconds, I received an almost functional faketime.c. Fixed, and annotated with docs:
/**
 * LD_PRELOAD library to "fake" the current time. Takes a
 * FAKETIME_OFFSET=<seconds> as environment variable.
 *
 * Compile:
 *   gcc -shared -fPIC -o faketime.so faketime.c -ldl -Wall
 * Run:
 *   FAKETIME_OFFSET=$((2*365*24*60*60)) LD_PRELOAD=$PWD/faketime.so date
 */
#define _GNU_SOURCE
#include <dlfcn.h>
#include <stdlib.h>
#include <sys/time.h>
#include <time.h>

static time_t offset_seconds = 0;

time_t time(time_t *tloc) {
    static time_t (*real_time)(time_t *) = NULL;
    time_t real, fake;
    if (!real_time)
        real_time = dlsym(RTLD_NEXT, "time");
    real = real_time(NULL);
    fake = real - offset_seconds;
    if (tloc)
        *tloc = fake;
    return fake;
}

int gettimeofday(struct timeval *tv, void *tz) {
    static int (*real_gettimeofday)(struct timeval *, struct timezone *) = NULL;
    int res;
    if (!real_gettimeofday)
        real_gettimeofday = dlsym(RTLD_NEXT, "gettimeofday");
    res = real_gettimeofday(tv, tz);
    if (res == 0)
        tv->tv_sec -= offset_seconds;
    return res;
}

int clock_gettime(clockid_t clk_id, struct timespec *tp) {
    static int (*real_clock_gettime)(clockid_t, struct timespec *) = NULL;
    int res;
    if (!real_clock_gettime)
        real_clock_gettime = dlsym(RTLD_NEXT, "clock_gettime");
    res = real_clock_gettime(clk_id, tp);
    if (res == 0 && (clk_id == CLOCK_REALTIME || clk_id == CLOCK_REALTIME_COARSE))
        tp->tv_sec -= offset_seconds;
    return res;
}

__attribute__((constructor))
void init() {
    const char *env = getenv("FAKETIME_OFFSET");
    if (env) {
        offset_seconds = strtoll(env, NULL, 10);
    } else {
        /* Default to 2 years (730 days) if not set */
        offset_seconds = 730 * 24 * 60 * 60;
    }
}
A quick polish, compilation with gcc -shared -fPIC -o
faketime.so faketime.c -ldl and test:
$ LD_PRELOAD=$PWD/faketime.so date
Tue May 30 11:29:26 UTC 2023
$ FAKETIME_OFFSET=$((-2*24*60*60)) LD_PRELOAD=$PWD/faketime.so date
Sat May 31 11:29:53 UTC 2025
Yup, it works, even with negative offsets for future dates.
But does it also work with iKVM? Drum rolls...
$ FAKETIME_OFFSET=$((2*365*86400)) LD_PRELOAD=$PWD/faketime.so ipmikvm 10.10.10.10
attempting login on '10.10.10.10' with user ADMIN
...
connect failed sd:16
Retry =1
Gtk-Message: 13:31:13.519: Failed to load module "canberra-gtk-module"
a singal 17 is raised
GetFileDevStr:4051 media_type = 40
Success! A working iKVM viewer. And another utility library for under my belt.
BMC upgrade anyway
When writing this post, I did fetch the BIOS firmware again, to double check some things, and I noticed that inside H12SSW-NTR_3.3_AS01.05.21_SAA1.2.0-p2.zip, there is both a BIOS zip and a and a BMC BMC_H12AST2500-ROT-2201MS_20250430_01.05.21_STDsp.zip file.
Through Maintenance > Firmware Management > Update and deselecting “Preserve SSL Certificate” the BMC firmware could be updated. (I guess that the SSL certificate update question only applies to the web certificate though.)
The update appeared to stall at Upload firmware : 75% for a while, but it completed after a few minutes. The web interface was ungrayed, but a FW Update Mode: Current system is in FW update mode, any configuration changes are not recommended notice stayed visible and the current and new BMC firmware versions were listed, along with an Update button (which you need to press, or nothing happens, pro-tip).
Updating from 01.00.25 to 01.05.21... took about 10 more minutes. After System is rebooting, Please wait! it might be done. You'll have to check yourself.
And after all that waiting, I was finally greeted with new certificates. Both for the web interface and the iKVM interface:
$ easycert -T 10.10.10.10 443
Certificate chain
 0 s: {9C:70:1A:CF:57:9E:B9:A1:CE:EB:B8:99:47:3C:A8:4D:88:1B:BD:16} [a8c7e6cd] C = US, ST = California, L = San Jose, O = Super Micro Computer, OU = Software, CN = IPMI, emailAddress = support@supermicro.com
   i: {9C:70:1A:CF:57:9E:B9:A1:CE:EB:B8:99:47:3C:A8:4D:88:1B:BD:16} [a8c7e6cd] C = US, ST = California, L = San Jose, O = Super Micro Computer, OU = Software, CN = IPMI, emailAddress = support@supermicro.com
---
Expires in 3622 days
$ easycert -T 10.10.10.10 5900
Certificate chain
 0 s: {68:6D:88:26:E2:B4:34:3F:CC:06:FC:E7:02:99:2B:6C:FC:57:61:7D} [a8c7e6cd] C = US, ST = California, L = San Jose, O = Super Micro Computer, OU = Software, CN = IPMI, emailAddress = support@supermicro.com
   i: {68:6D:88:26:E2:B4:34:3F:CC:06:FC:E7:02:99:2B:6C:FC:57:61:7D} [a8c7e6cd] C = US, ST = California, L = San Jose, O = Super Micro Computer, OU = Software, CN = IPMI, emailAddress = support@supermicro.com
---
Expires in 3622 days
Ok. No faketime.so needed anymore.
Hardware crash
Unfortunately, the BMC firmware upgrade came with a “present”:
mlx5_core 0000:81:00.0: temp_warn:165:(pid 0): High temperature on sensors with bit set 0 1
mlx5_core 0000:81:00.1: temp_warn:165:(pid 0): High temperature on sensors with bit set 0 1
...
mlx5_core 0000:81:00.0: mlx5_crdump_collect:50:(pid 1100352): crdump: failed to lock vsc gw err -16
mlx5_core 0000:81:00.0: mlx5_health_try_recover:327:(pid 1100352): handling bad device here
mlx5_core 0000:81:00.0: mlx5_error_sw_reset:233:(pid 1100352): start
mlx5_core 0000:81:00.1: mlx5_crdump_collect:50:(pid 1031132): crdump: failed to lock vsc gw err -16
mlx5_core 0000:81:00.1: mlx5_health_try_recover:327:(pid 1031132): handling bad device here
mlx5_core 0000:81:00.1: mlx5_error_sw_reset:233:(pid 1031132): start
mlx5_core 0000:81:00.0: NIC IFC still 7 after 1000ms.
mlx5_core 0000:81:00.0: mlx5_error_sw_reset:266:(pid 1100352): end
mlx5_core 0000:81:00.1: NIC IFC still 7 after 1000ms.
mlx5_core 0000:81:00.1: mlx5_error_sw_reset:266:(pid 1031132): end
mlx5_core 0000:81:00.0: mlx5_wait_for_pages:735:(pid 1100352): Skipping wait for vf pages stage
mlx5_core 0000:81:00.1: mlx5_wait_for_pages:735:(pid 1031132): Skipping wait for vf pages stage
mlx5_core 0000:81:00.0: mlx5_health_try_recover:330:(pid 1100352): health recovery flow aborted, PCI reads still not working
mlx5_core 0000:81:00.1: mlx5_health_try_recover:330:(pid 1031132): health recovery flow aborted, PCI reads still not working
Not sure if the upgrade was the culprit, but mid-upgrade the Mellanox network devices both crashed. Unloading and reloading the kernel modules did not revive them, so a reboot was needed.
Luckily I didn't have to fight the expired certificate this time.
2025-05-05 - windows install / media driver missing / ventoy
Recently I had the misfortune of assisting someone with installing Windows 11 on their computer. I tried to push Ubuntu/Linux on them, but they wouldn't budge. So I begrudgingly prepped the USB stick with the ISO and got the installer running.
# dd if=windows11.iso of=/dev/sdx \
    bs=1M status=progress oflag=dsync
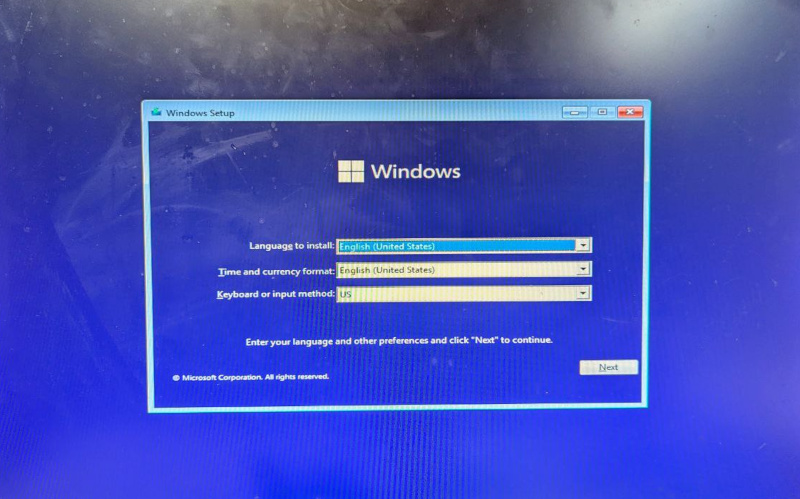
The ISO boots from USB. So, writing the USB was successful. And we got language selection.
But, on the second screen, we were greeted with the following error:
A media driver your computer needs is missing. This could be a
  DVD, USB or Hard disk driver.
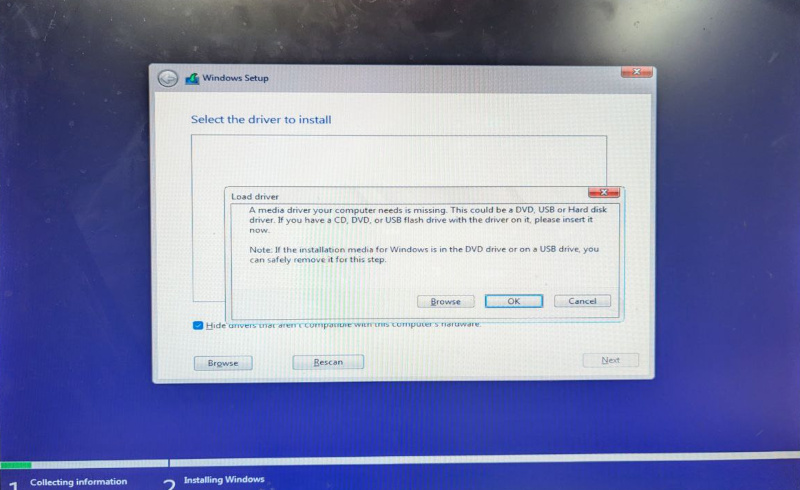
A media driver your computer needs is missing
The message seems descriptive, but really it isn't. The BIOS had detected all the drives in this machine: an M.2, and two SSD SATA drives. What are you not detecting? SSDs on SATA that have existed for ages now. Surely Windows driver support cannot be this bad.
The two logical options would be either to get specific motherboard drivers (unexpected, but possible if Windows is really lacking in support, or if this hardware was really uncommon), or that a BIOS setting needed to be adjusted.
The Gigabyte B550M had "preinstall" drivers, which I downloaded onto a second(!) USB. One of the NVMe drivers was visible (supposedly compatible) for installation, but after some loading, it wasn't compatible/usable anyway.
For BIOS options, the internet told us to disable (or enable!) various BIOS options, related to: CSM, TPM, Secure boot, AHCI, Legacy USB. And switching from a USB 3.0 or a USB 2.0 port, or vice versa. Nothing helped.
Lastly, I reconsidered the advice that writing the USB had to be done using the Media Creation Tool or Rufus.exe. This did not make sense to me, because it booted just fine, so what could be wrong with my dd-written USB? But, we'd have to try this option too.
I run Linux on my systems, so I did not have any Windows laying around to run Media Creation Tool or Rufus with. When looking for Linux alternatives to those, the internet pointed to Ventoy.
Ventoy
Ventoy is not, like I thought it would be, a tool that writes an ISO to your USB stick, like dd(1). No, you don't tell it which ISO to write. Instead, it sets up a nifty boot loader and an empty filesystem.
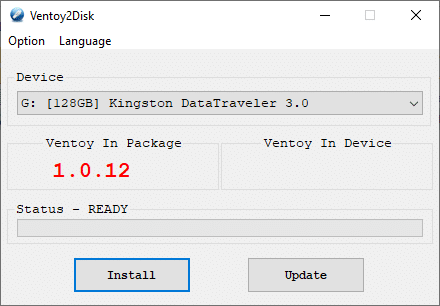
Initializing the USB stick was easy with the GUI installer. Unplugging and plugging the USB back in was sufficient for Ubuntu to recognise the Ventoy filesystem on the stick. Now it was a simple matter of copying the ISO to that filesystem — using cp(1), not dd(1).
Lo and behold, when booting we were presented with something akin to this:
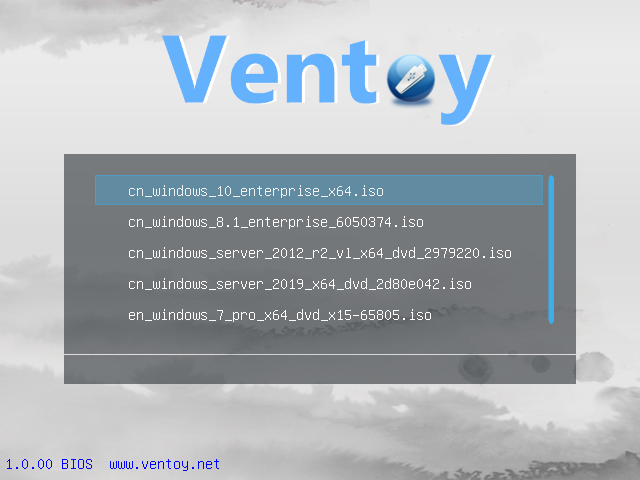
Nice! We can have a bootable USB stick with several installation options. One stick, many installs — no more last-minute flashing. (On top of that, Ventoy can leave free space for general purpose partitions.)
And the interesting part: the Windows 11 installer now looked slightly different.
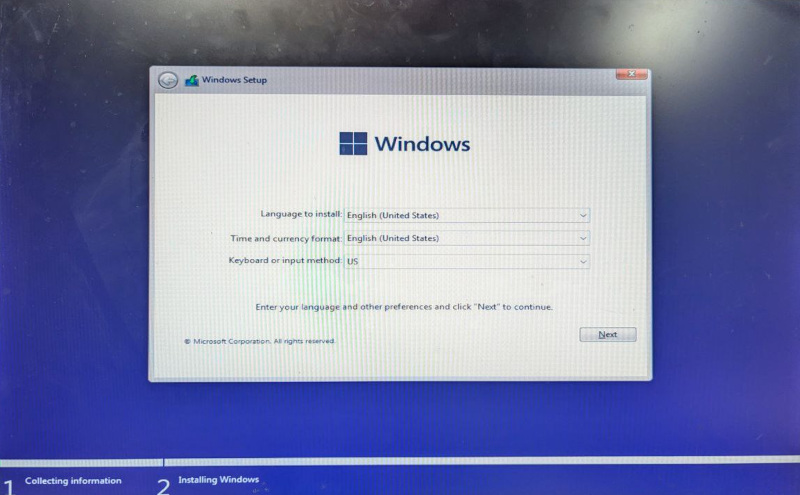
Observe how the title bar is now gray instead of blue, how it says Collecting information at the bottom and how the rest of the design matches the following screen.
And that's not all, pressing next, greeted us with a partition selection like one would expect:
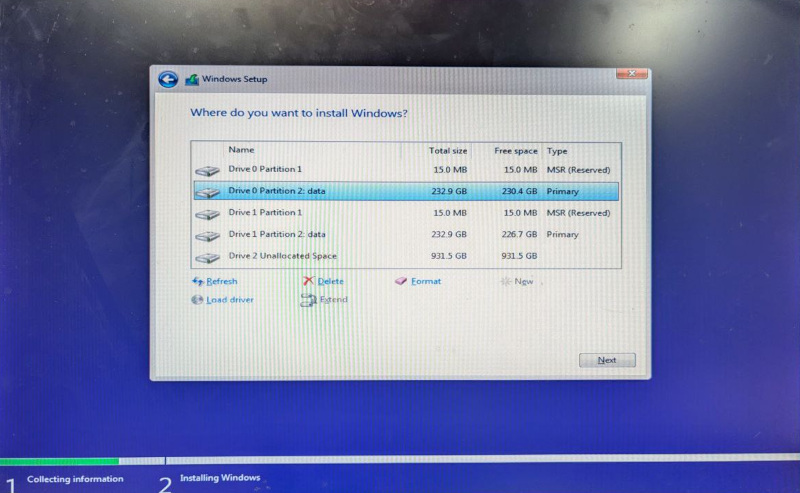
And the rest of the installation worked as expected.
Two morals of the story this time:
- When creating a bootable Linux USB, using dd(1) is sufficient, but for a Windows ISO it is not.
- I can get used to this Ventoy boot loader. Having bootable installers for multiple operating systems on a single USB stick sounds super convenient.
2025-04-15 - pveproxy / systemd journald / perl buffering
Because I was debugging — what later turned out to be — an application firewall that was messing with my connections to Proxmox pveproxy on port 8006, I wanted more debug logs. Telling pveproxy to give me more info gave me a bit of a hard time.
Connections from a remote peer would get disconnected, and it initially looked like pveproxy was to blame.
Step one: get more info from pveproxy.
pveproxy has a pveproxy start
--debug=1 mode. I added that to the systemd config using
an /etc/systemd/system/pveproxy.service.d/override.conf file:
[Service]
# Wipe the original ExecStart= first.
ExecStart=
# Enable debugging.
ExecStart=/usr/bin/pveproxy start --debug=1
Alas, this refused to start, because --debug runs in the foreground. Add Type=simple:
[Service]
# pveproxy --debug stays in the foreground.
Type=simple
# Wipe the original ExecStart= first.
ExecStart=
# Enable debugging.
ExecStart=/usr/bin/pveproxy start --debug=1
Okay. The pveproxy service now started successfully. But no extra logging appeared. Except.. after a restart there suddenly were logs.
I've seen this before. Output buffering? Yes.
Output buffering is an optimization where output isn't flushed after every line, but first when a larger buffer is full. Useful if you're writing lots of output. Terrible if it means that log output is saved for later. I want to see my debug output live.
For Python, there is the PYTHONUNBUFFERED=1 environment
variable or the python -u flag. pveproxy is a Perl
application however. ChatGPT will gladly hallucinate a
PERL_UNBUFFERED=1, but that doesn't exist.
You need this code instead:
select STDERR;$|=1;select STDOUT;$|=1;
Doing file descriptor modifications, just before program start, with stdbuf(1) doesn't fix things. And I did not want to install Expect just for the unbuffer(1) application.
Is there another way to inject the
$|=1; without modifying the existing Perl script?
I settled for the following. (I did have some trouble with systemd escaping at first. Not sure if that was an older systemd or just a brain fart on my end.)
[Service]
# pveproxy --debug stays in the foreground.
Type=simple
# Wipe the original ExecStart= first.
ExecStart=
# Enable debugging, with PERL_UNBUFFERED=1.
#ExecStart=/usr/bin/pveproxy start --debug=1
#ExecStart=/bin/sh -c 'exec /usr/bin/perl -Te '\''select STDERR;$|=1;select STDOUT;$|=1;do "/usr/bin/pveproxy" or die "Could not run: $@ $!";'\'' -- start --debug=1'
ExecStart=/usr/bin/perl -Te 'use strict;use warnings;select STDERR;$|=1;select STDOUT;$|=1;my $s="/usr/bin/pveproxy";do $s;die "Failed to start $s: $!" if $!;' -- start --debug=1
Now pveproxy starts and the debug output appears in journald as soon as it's written.
For the record, the debug output turned out to be useless.
Instead, tcpdump revealed that traffic from the client would contain data (a
[P], for the TLS ClientHello),
but when looking at the traffic on the receiving host, I would
see a [R] (reset). The TCP traffic had been altered to
tear down the connection in the outbound direction.
Apparently there was an application firewall in the middle,
sniffing that port 8006 traffic, and deciding
that TLS was dangerous on non-443 ports. *Sigh*
2025-03-17 - sed / regular expressions / optimizing
Last week, we were looking at using sed(1) to remove line feeds from CSV files. The regular expressions in that post could use some further inspection.
I'm sorry that this is a rather dry post. I wanted to get the numbers out there because the differences are significant. But without the example runs you're just left with numbers.
Feel free to skip right to the conclusions.
To recap: we were working on multiline CSV files. Matching even and odd numbers of double quotes is relevant, because they tell us whether or not we're still working on the same row.
We start off by creating two sample files:
$ python3 -c 'for x in range(100000): print("A"*1500)' >many-alpha1500.dat
$ python3 -c 'for x in range(100000): print("\""*1500)' >many-dquotes1500.dat
many-alpha1500.dat has 100k lines with 1500 letters
A: zero double quotes.
many-dquotes1500.dat has 100k lines with 1500 double
quotes: basically everything is a double quote.
We want to compare the speed of a match versus a non-match, and take printing a line or not out of the equation. For sed we add !d or d to the case that matches:
$ time sed -Ee '/^[^"]*("[^"]*"[^"]*)*$/d' many-alpha1500.dat | md5sum
d41d8cd98f00b204e9800998ecf8427e  -

real  0m4.950s (all user time)
The astute reader will recognise
d41d8cd98f00b204e9800998ecf8427eas the empty md5 hash. We want no output, because printing would affect the timing.
The regular expression from the previous post, which was quickly cobbled together, looked like this:
/^[^"]*("[^"]*"[^"]*)*$/
That is, zero-or-more non-double quotes, then a combination of two double quotes with non-double quotes around it, and that as many times as possible. Or, in plain English: an even amount of double quotes.
Reducing backtracking
Regular expression backtracking wisdom says you need to avoid
optional matches (?, *, +).
Rewriting this slightly to /^([^"]|"[^"]*")*$/ makes sense,
both for clarity and fewer optionals.
For speed it doesn't seem to matter though.
$ time sed -Ee '/^[^"]*("[^"]*"[^"]*)*$/d' many-alpha1500.dat | md5sum
d41d8cd98f00b204e9800998ecf8427e  -

real  0m4.901s (all user time)
$ time sed -Ee '/^([^"]|"[^"]*")*$/d' many-alpha1500.dat | md5sum
d41d8cd98f00b204e9800998ecf8427e  -

real  0m4.844s (all user time)
$ time sed -Ee '/^[^"]*("[^"]*"[^"]*)*$/d' many-dquotes1500.dat | md5sum
d41d8cd98f00b204e9800998ecf8427e  -

real  0m4.071s (all user time)
$ time sed -Ee '/^([^"]|"[^"]*")*$/d' many-dquotes1500.dat | md5sum
d41d8cd98f00b204e9800998ecf8427e  -

real  0m4.098s (all user time)
The regular expression did not seem to matter, but the dataset did. For some reason, the matching double quotes take a slightly faster path.
Here it's hard to tell whether it's slow because of backtracking,
or because of something else in the regex. It's not the address code itself,
because replacing the regex with /./ or /(.*)/
makes it fast. And when feeding it double quotes (the "hard" case),
it was in fact faster (0m4.071s/0m4.098s); maybe because of the larger match between parentheses?
What we do observe though, is if we make it not-matching (look for an uneven count of double quotes), it's suddenly fast for the A case:
$ time sed -Ee '/^([^"]|"[^"]*")*"[^"]*$/!d' many-alpha1500.dat | md5sum
d41d8cd98f00b204e9800998ecf8427e  -

real  0m0.365s (all user time)
My instinct says those two matches should take the same amount of time on a long string of A characters. But apparently I'm wrong.
The lots-of-double-quotes case is now (expectedly) slow, even though it doesn't match either.
$ time sed -Ee '/^([^"]|"[^"]*")*"[^"]*$/!d' many-dquotes1500.dat | md5sum
d41d8cd98f00b204e9800998ecf8427e  -

real  0m4.490s (all user time)
grep and perlre
We take a quick detour using grep.
grep differentiates between our old and our new regular expression:
$ time grep -vE '^[^"]*("[^"]*"[^"]*)*$' many-alpha1500.dat | md5sum
d41d8cd98f00b204e9800998ecf8427e  -

real  0m13.411s (all user time)
$ time grep -vE '^([^"]|"[^"]*")*$' many-alpha1500.dat | md5sum
d41d8cd98f00b204e9800998ecf8427e  -

real  0m21.086s (all user time)
.. but in a bad way. The — in my opinion — better expression performs worse. And it's horribly slow compared to sed.
grep can also do Perl regular expressions
(perlre, using the -P option). Let's see how
that compares:
$ time grep -vE '^.*$' many-alpha1500.dat | md5sum
d41d8cd98f00b204e9800998ecf8427e  -

real  0m0.403s (all user time)
$ time grep -vP '^.*$' many-alpha1500.dat | md5sum
d41d8cd98f00b204e9800998ecf8427e  -

real  0m0.106s (all user time)
Using -P is twice as fast for the most basic expression.
Let's try a slightly less simple, but still trivial, one:
$ time grep -vE '^[^"]*$' many-alpha1500.dat | md5sum
d41d8cd98f00b204e9800998ecf8427e  -

real  0m4.062s (all user time)
$ time grep -vP '^[^"]*$' many-alpha1500.dat | md5sum
d41d8cd98f00b204e9800998ecf8427e  -

real  0m0.113s (all user time)
The above example tells us that using even the simplest regular expressions can be slow using the old POSIX engine in grep. Perl or other modern implementations will be slightly faster in trivial cases, and insanely much faster in slightly more complicated cases:
$ time grep -vE '^([^"]|"[^"]*")*$' many-alpha1500.dat | md5sum
d41d8cd98f00b204e9800998ecf8427e  -

real  0m21.072s (all user time)
$ time grep -vP '^([^"]|"[^"]*")*$' many-alpha1500.dat | md5sum
d41d8cd98f00b204e9800998ecf8427e  -

real  0m0.267s (all user time)
And no, before you ask, memory usage is only slightly higher when using the Perl engine.
Summary
Here's a quick summary of the results from above, although it doesn't show all the nuance between the different inputs and matching vs. non-matching.
sed -E |
grep -E |
grep -P |
|
|---|---|---|---|
^.*$ | 2.40 | 0.40 | 0.11 |
^[^"]*$ | 4.25 | 4.15 | 0.11 |
^([^"]|"[^"]*")*$ | 5.00 | 21.20 | 0.32 |
^[^"]*("[^"]*"[^"]*)*$ | 5.00 | 13.70 | 0.11 |
(Lower is better.)
And what about Python? Yes, there is that too. More different results. Hard to keep track of all dimensions now. And now there is even system time involved.
$ time python -c "$(printf '%s\n' \
    'import re;import sys;c=re.compile(r'\''^[^"]*("[^"]*"[^"]*)*$'\'')' \
    'for l in sys.stdin:' ' if not c.match(l):' '  print(l)')" \
    < many-alpha1500.dat | md5sum
d41d8cd98f00b204e9800998ecf8427e  -

real  0m0.122s
user  0m0.086s
sys   0m0.036s
$ time python -c "$(printf '%s\n' \
    'import re;import sys;c=re.compile(r'\''^[^"]*("[^"]*"[^"]*)*$'\'')' \
    'for l in sys.stdin:' ' if not c.match(l):' '  print(l)')" \
    < many-dquotes1500.dat | md5sum
d41d8cd98f00b204e9800998ecf8427e  -

real  0m4.176s
user  0m2,768s
sys   0m1.369s
I give up trying to explain any of this.
Conclusions
The conclusions I draw from the above are:
- you should test your regular expressions on exaggerated (larger) datasets instead of assuming, and
- before you try to optimize your regular expressions you may want to consider a different regular expression engine instead,
- and you'll probably want to avoid both
grep -Eandsedaltogether if speed matters.
2025-03-15 - sed / remove line feeds / csv
Can you use sed(1) to remove line feeds?
Yes you can. Even though sed, the stream editor, is line based, you can use it to remove line feeds from output.
In this post we'll be exploring how that is done and look into how a slight refactoring step can provide a big speed gain. The task at hand is removing line feeds from CSV file with multiline strings. Why? Because I want to use grep and awk on it, and multiline strings would complicate that a lot. Why sed? Because I wanted to know if it's as easy as I think it should be.
Let's dig in.
sample.csv
We'll start off with a small sample.csv that we can play around with, to get us going:
idx,name,year,summary,url
1,"Electromagnetic Field 2018",2018,"EMF2018 geek village in the summer at:
Eastnor Castle Deer Park
Eastnor
Herefordshire (UK)",https://www.emfcamp.org/schedule/2018
2,"Legoland trip",2019,"Went to Billund for team building.",https://www.osso.nl/blog/2019/recap2019/
3,"MCH2022 ""May Contain Hackers""",2022,"Nonprofit outdoors hacker camp.
Location: Zeewolde (NL)",https://wiki.mch2022.org/Village:OSSO
4,"WHY2025 ""What Hackers Yearn""",2025,"Successor to MCH2022.",-
As you can see, this CSV file has one header row and four CSV data rows. But because some rows are split over multiple lines, doing a simple grep, cut or awk will not work as intended.
Here's a feedble attempt to get all the URLs from the fifth column, by asking awk to split by comma:
$ awk -F, '{print $5}' sample.csv
url


https://www.osso.nl/blog/2019/recap2019/


-
As expected, awk will not work, as it works on the lines, and has no idea where a record/row begins.
Quick sidenote: using
cut -d, -f5 sample.csvwould produce different, and even more wrong, output. If there is no fifth field, you'll get an earlier field instead. See this example:$ echo how | cut -d, -f2,3,4 how $ echo how,are,you | cut -d, -f2,3,4 are,youThat's unexpected behaviour that awk avoids.
The goal
Selecting the URLs from the CSV sample would have worked fine, had it looked like this:
idx,name,year,summary,url
1,"Electromagnetic Field 2018",2018,"EMF2018 geek village in the summer at: Eastnor Castle Deer Park Eastnor Herefordshire (UK)",https://www.emfcamp.org/schedule/2018
2,"Legoland trip",2019,"Went to Billund for team building.",https://www.osso.nl/blog/2019/recap2019/
3,"MCH2022 ""May Contain Hackers""",2022,"Nonprofit outdoors hacker camp. Location: Zeewolde (NL)",https://wiki.mch2022.org/Village:OSSO
4,"WHY2025 ""What Hackers Yearn""",2025,"Successor to MCH2022.",-
Here we have one header and four rows, and they add up to five lines. Selecting the fifth column is easy now:
$ awk -F, '{print $5}' goal.csv
url
https://www.emfcamp.org/schedule/2018
https://www.osso.nl/blog/2019/recap2019/
https://wiki.mch2022.org/Village:OSSO
-
As you may have noticed, a comma in CSV column/string would trip us up. Ignore that for now. You can argue that using regular unix utilities to work with CSV files is the wrong approach, but I think that often times the command line is king. If you're working with new/varied data, using the command line to quickly explore and prototype is unbeatable. You can choose a real programming language later when you're done prototyping.
So, we have the input (sample.csv), and we have the output (goal.csv
with md5 hash d7a5eba9e0a80a1d8c1158a1430927a3).
Can we coax sed into producing goal.csv? We can.
(I used the md5 hash to confirm that all the versions of goal.csv are equal.)
Attempt #1: making it work
Here's attempt one, which I have to admit took me longer to produce than I wanted. And I have to say ChatGPT was of no help at all. I can tell you its sed skills are abysmal.
#!/bin/sed -Ef

# Append line to hold space, clear pattern
# space, put hold space in pattern space.
H
z
x

# If pattern space contains an uneven number of
# double quotes, place everything back into the
# hold space and don't display.
/^[^"]*("[^"]*"[^"]*)*"[^"]*$/ {
    h
    d
}

# If pattern space contains an even number of
# double quotes, we're done collecting.
# The first hold added a linefeed to void,
# remove it now.
# Replace the others with a single space.
/^[^"]*("[^"]*"[^"]*)*$/ {
    s/^\n//
    s/\n/ /g
}
That's my first working attempt:
$ ./attempt-1.sed | md5sum
d7a5eba9e0a80a1d8c1158a1430927a3  -
It works! But it has a couple of odd quirks.
Taking you through it one by one:
- sed has two buffers: the pattern buffer and the hold buffer. You're always working on the pattern buffer. The first H appends the input (the current pattern) to the hold buffer.
- The z wipes (zeroes) the pattern buffer, the x swaps them. Now the pattern buffer has all the collected input so far.
- The
/^[^"]*("[^"]*"[^"]*)*"[^"]*$/regex checks that there is an uneven number of double quotes: if it is uneven, the pattern buffer is replaced into the hold buffer, the line is deleted (not printed), and the cycle restarts. - If we get to the next regex
(
/^[^"]*("[^"]*"[^"]*)*$/) we've confirmed that the quotes are even. We remove the first linefeed (which got added after the first H) and replace the rest with a single space. - If we get here, we're not replacing the pattern buffer into the hold buffer (using h), so the next cycle starts clean.
So. That works. And after looking more into the sed info pages, it turns out that the d command restarts the cycle. That means that the second regex match isn't even needed. It could instead just be:
# If we get here, the pattern space contains an
# even number of double quotes. The first hold
# added a linefeed to void, remove it now.
# Replace the others with a single space.
s/^\n//
s/\n/ /g
Attempt #2: use only the pattern buffer
When working with real data, it turned out that this was rather slow. For a simple 1000 row, 1 MiB file, having the script take more than a second seemed inappropriate.
The thing that immediately stands out is the swapping between pattern and hold space. Step one is avoiding that.
#!/bin/sed -Ef

:x

# If pattern space contains an uneven number of
# double quotes, add more to the line and
# continue at x.
/^[^"]*("[^"]*"[^"]*)*"[^"]*$/ {
    N
    bx
}

# Apparently we have an even number of double
# quotes. Remove LFs and print (by ending the
# cycle).
s/\n/ /g
This looks better already. We don't need the hold buffer at all.
- The N reads a new line and appends it to the pattern buffer.
- bx jumps back to the :x label.
- This repeats for as long as there is an uneven amount of double quotes in the pattern buffer.
- Once the double quotes are even, we end up on the last line.
- There we replace the line feeds with spaces and let the cycle restart with the automatic printing of the pattern buffer.
Is it faster?
Well.. according to a couple of sample runs with a 1.3 MiB dataset, maybe we go from 690ms to 670ms. Definitely not earth shattering speed gains. What's next?
Attempt #3: stop doing double work
On to fix the real problem, the repetitive regular expression. The data set I'm working with at the moment looks like this:
$ wc dataset.csv
  23679  156039 1389021 dataset.csv
$ ./attempt-2.sed dataset.csv | wc
   1001  156039 1389021
A 1.3 MiB file, 1001 rows, 23679 lines. On average, that's 27 lines per row and 1388 bytes per row.
That means that on average, it has to rerun the regular expression 27 times before it doesn't match anymore (because the double quotes are even). And it has to do so on a line that grows to up to 1388 characters:
1,"Electromagnetic Field 2018",2018,"EMF2018 geek village in the summer at:
Uneven amount of quotes? Yes, 3. Restart.
1,"Electromagnetic Field 2018",2018,"EMF2018 geek village in the summer at:
Eastnor Castle Deer Park
Still uneven amount of quotes? Yes, 3. Restart.
1,"Electromagnetic Field 2018",2018,"EMF2018 geek village in the summer at:
Eastnor Castle Deer Park
Eastnor
Still uneven amount of quotes? Yes, 3. Restart again.
You can see how that's inefficient. It would be better if it just counted the double quotes on the latest input line.
Attempt #3 of the script fixes that:
#!/bin/sed -nEf

# Find an uneven amount of double quotes.
# If found, populate hold space, load next line
# and jump to inquote.
/^[^"]*("[^"]*"[^"]*)*"[^"]*$/ {
    h
    n
    b inquote
}

# Not found? Jump to done.
b done

# Loop here until the input line also has an
# uneven amount of quotes: uneven + uneven is
# even. In the mean time, add to the hold
# buffer and fetch the next line.
:inquote
/^[^"]*("[^"]*"[^"]*)*"[^"]*$/ {
    H
    x
    b done
}
H
n
b inquote

:done
s/\n/ /g
# sed -n and manual printing is needed,
# otherwise the 'n' will print the pattern
# space.
p
Admittedly, this looks a lot less like a sed oneliner, and more like an obscure programming language. But, boy, it is so much faster. With the same dataset, we go down to mere milliseconds.
It works like this:
- Find an uneven amount of double quotes. If not found, jump to the done label.
- At the done label, we replace the line feeds, and print the output. Restart the cycle.
- If we did find an uneven amount of double quotes, store the pattern in the hold space, get the next pattern, and go to the inquote label.
- At inquote we also look for an uneven amount of quotes. If not found it means that we're not done (uneven + even = uneven). We append the pattern to the hold buffer using H and load up the next pattern with n. Go back to inqoute.
- If we did find an uneven amount of double quotes, we're
done (uneven + uneven = even). Append this line as well with
H, and then exchange the hold and the pattern buffer with
x so we can work on the entire line. (Using
H;xis the same asx;Gin this case.) Go to done (see above).
Timings
For completeness sake, here are some representative timing outputs:
$ time ./attempt-1.sed dataset.csv >/dev/null

real  0m0.696s (all user time)
$ time ./attempt-2.sed dataset.csv >/dev/null

real  0m0.664s (all user time)
$ time ./attempt-3.sed dataset.csv >/dev/null

real  0m0.033s (all user time)
As you can see, that's much better.
In the next post, we'll see if we can improve the regular expressions.